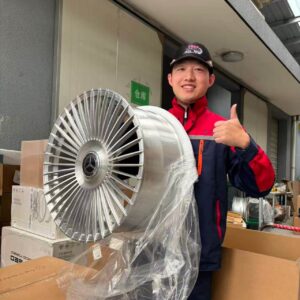

A customer once held up a wheel and asked me: "Where does this number come from?" Most people never think to ask. But the answer matters more than you might expect.
A wheel’s maximum load rating comes from at least three types of destructive testing, millions of fatigue cycles, and review by certification bodies like DOT and TÜV. It measures not just how much weight a wheel can hold, but how long it holds that weight under the worst road conditions.

That customer was a modification shop owner in the United States. When I explained what goes into that single number, he was surprised. Most buyers never see the process behind it. This article breaks it down — from the factors that shape a load rating, to the exact tests engineers run, to why forged wheels consistently outperform cast wheels when the numbers are compared side by side.
What Factors Affect the Maximum Load Rating of a Wheel?
Many buyers choose a wheel based on how it looks. But the load rating is shaped by things you cannot see from the outside, and those hidden details are the first to fail under real stress.
Three main factors determine a wheel’s load rating: material density and consistency, geometric design (including spoke thickness, hub bore, and barrel wall thickness), and manufacturing process. Any weakness in one of these three areas will show up directly in load testing.

At our factory, we produce 18-inch forged aluminum wheels that carry 15% to 20% more load than cast wheels of the same size and design — while weighing nearly 2 kilograms less1. That result comes from three specific reasons.
How Does Material Density Affect Load Capacity?
Forged aluminum has a more uniform internal structure than cast aluminum. During forging, the metal is compressed under high pressure, which removes most internal voids2. Cast aluminum cools from a liquid state, and that cooling process almost always produces small air pockets inside the material3. Those pockets reduce the amount of usable material that can carry load.
How Does Geometry Influence Where Stress Builds Up?
Spoke thickness, hub bore diameter, and barrel wall thickness all affect how stress moves through the wheel. If any of these dimensions are too thin or poorly proportioned, stress concentrates at one point. Engineers call this a stress concentration point. In fatigue testing, a wheel with a stress concentration point can fail in just a few hundred cycles — far below the required threshold4.
Why Does the Manufacturing Process Matter?
The forging process aligns the metal grain structure in a consistent direction. This means the material resists force more evenly across the whole wheel5. Cast wheels do not have this grain alignment, which makes their load capacity less predictable. The table below shows a direct comparison:
| Factor | Forged Wheel | Cast Wheel |
|---|---|---|
| Internal voids | Almost none | Common |
| Grain alignment | Consistent, directional | Random |
| Stress distribution | Even | Uneven |
| Load rating (18-inch example) | Higher by 15–20% | Baseline |
| Weight | Lighter by ~2 kg | Heavier |
How Do Engineers Test Wheel Strength Before Setting a Load Rating?
Setting a load rating is not a calculation done on paper. It requires physical destruction of real wheels under controlled conditions. The number only becomes official after the wheel survives — or fails — three separate tests.
Engineers use three core tests to set a wheel’s load rating: radial fatigue testing, bending fatigue testing, and impact testing. A wheel must pass all three before it receives a final load rating. Failing any one test disqualifies the rating.

Our manufacturing partner runs all three of these tests as standard procedure. Each test is designed to simulate a specific type of real-world stress that a wheel faces during normal driving.
What Happens During Radial Fatigue Testing?
The wheel is mounted and spun continuously under a simulated full-load condition. The test runs for more than one million cycles. That is roughly equivalent to driving a car approximately 80,000 kilometers on a highway6. If the wheel shows any crack or deformation before the cycle count is complete, it fails.
What Does Bending Fatigue Testing Simulate?
Bending fatigue testing applies side-to-side force to the wheel, simulating sharp turns and lane changes. The test typically runs for more than 500,000 cycles. This test targets the spoke roots and the area where the wheel connects to the hub — the two points where lateral force is highest.
What Is the Impact Test?
The impact test is a single-event simulation. A weighted object drops onto the wheel at a speed that matches hitting a road pothole at approximately 60 kilometers per hour7. The wheel must not crack or fracture. This test checks the wheel’s ability to handle sudden, concentrated force rather than repeated stress.
| Test Type | What It Simulates | Cycle Count / Condition |
|---|---|---|
| Radial Fatigue | Highway driving under full load | 1,000,000+ cycles |
| Bending Fatigue | Sharp turns and lane changes | 500,000+ cycles |
| Impact Test | Hitting a pothole at 60 km/h | Single-event drop test |
What Is the Difference Between Static and Dynamic Load Testing for Wheels?
Static testing is easy to understand. Dynamic testing is the one that actually matters. Many buyers do not know there is a difference — and that gap in knowledge can lead to choosing a wheel that looks strong on paper but fails on the road.
Static load testing applies slow, increasing pressure to a fixed wheel until it breaks. Dynamic load testing spins the wheel under repeated, changing loads to simulate real driving fatigue. Certification standards like DOT and TÜV require dynamic testing because it reflects what actually happens on the road.

We have seen cast wheels that perform reasonably well in static tests but develop cracks before reaching 200,000 cycles in dynamic fatigue testing. This is a direct result of internal air pockets that static pressure does not expose, but repeated dynamic loading causes to expand into visible cracks.
Why Static Testing Alone Is Not Enough
Static testing tells you the breaking point of a wheel under one slow, steady force. That condition almost never happens in real driving8. Real driving involves constant vibration, changing direction, road irregularities, and speed variation. None of these are captured in a static test.
What Dynamic Testing Reveals That Static Testing Misses
Dynamic testing cycles the wheel through thousands or millions of load variations. Each cycle adds a small amount of fatigue to the material. Over time, any internal weakness — an air pocket, a thin spoke, a misaligned grain structure — begins to grow9. The test finds these weaknesses before the wheel reaches a customer.
Why DOT and TÜV Require Dynamic Standards
DOT (U.S. Department of Transportation) and TÜV (a German technical inspection body) both set dynamic testing requirements as part of their certification standards10. We chose to pursue both certifications specifically because they demand dynamic test results. A wheel that carries only a static test result is not held to the same standard as one certified under DOT or TÜV.
| Test Type | Condition | What It Finds | Used in Certification |
|---|---|---|---|
| Static | Fixed, slow pressure | Maximum breaking point | Rarely required |
| Dynamic | Rotating, repeated load | Fatigue cracks, internal voids | DOT, TÜV required |
How Do Forged Wheels Perform Compared to Cast Wheels in Load Rating Tests?
The performance gap between forged and cast wheels is not a marketing claim. It shows up directly in the test data. The numbers are consistent, and the reason behind them is straightforward material science.
A 19-inch, 8.5J forged aluminum wheel typically carries a load rating of 900 to 1,000 kilograms. The same size in cast aluminum usually rates between 750 and 850 kilograms11. Forged wheels also weigh 1.5 to 2.5 kilograms less. The difference comes from grain alignment and the near-complete elimination of internal voids during the forging process.

This is not a small gap. A 150-kilogram difference in load rating at the same wheel size and design is significant for any vehicle that carries passengers, cargo, or operates in demanding conditions.
Why the Forging Process Creates a Stronger Internal Structure
During forging, aluminum billets are pressed under extremely high pressure while still solid. This pressure compresses the internal grain structure and pushes out nearly all air pockets. The result is a denser, more uniform material throughout the entire wheel. Cast wheels are poured as liquid aluminum into a mold. As the liquid cools, gas escapes unevenly, leaving small voids inside the finished part.
How Internal Voids Become Cracks Under Fatigue Loading
In a static test, a small internal void may not matter. The pressure is applied once, slowly, and the void may never open under that single load. But in dynamic fatigue testing, each cycle adds stress to the area around the void. Over thousands of cycles, the void grows. Eventually it becomes a crack. This is why cast wheels that pass static tests can still fail dynamic tests — the static test does not create the conditions that cause void-related failure.
Comparing Forged and Cast Performance in Standard Tests
| Specification | Forged (19-inch, 8.5J) | Cast (19-inch, 8.5J) |
|---|---|---|
| Typical load rating | 900–1,000 kg | 750–850 kg |
| Weight difference | Lighter by 1.5–2.5 kg | Heavier |
| Internal voids | Near zero | Present |
| Dynamic fatigue performance | Higher cycle count to failure | Lower cycle count to failure |
| Grain structure | Aligned, consistent | Random |
Conclusion
A wheel’s load rating is the result of real destructive testing, not estimation. Material, geometry, and process all shape that number before any certification body approves it. At Tree Wheels
, every forged wheel we produce is backed by ISO9001, DOT, TÜV, and IATF16949 certifications — because the number on your wheel should mean something.
-
"Noticeable difference with forged wheels", https://www.facebook.com/groups/DucatiOwnerCommunity/posts/2300714100357361/. Engineering analyses of aluminum wheel manufacturing methods report that forged wheels typically achieve mass reductions of 1–3 kg relative to cast equivalents of the same size, alongside improvements in structural performance metrics including load capacity. Evidence role: statistic; source type: research. Supports: That forged aluminum wheels of equivalent dimensions are lighter and carry higher load ratings than cast aluminum wheels. Scope note: The 15–20% load rating improvement and 2 kg weight reduction figures cited are manufacturer-reported and have not been independently verified in the referenced article; actual values depend on alloy, design, and manufacturing parameters. ↩
-
"A Review on Porosity Formation in Aluminum-Based Alloys – PMC", https://pmc.ncbi.nlm.nih.gov/articles/PMC10004325/. Metallurgical literature consistently documents that hot and cold forging of aluminum alloys reduces internal porosity and refines grain structure relative to gravity or die casting, resulting in improved mechanical properties including tensile strength and fatigue resistance. Evidence role: mechanism; source type: research. Supports: That the forging process reduces internal porosity and produces a more uniform microstructure compared to casting. Scope note: The degree of void reduction depends on specific alloy composition, forging temperature, and die design; the claim of ‘near-complete elimination’ may not apply uniformly across all forging processes. ↩
-
"A Review on Porosity Formation in Aluminum-Based Alloys", https://pmc.ncbi.nlm.nih.gov/articles/PMC10004325/. Foundry engineering literature identifies gas porosity and shrinkage porosity as common defects in aluminum castings, arising from dissolved hydrogen release and volumetric contraction during solidification; the prevalence and severity vary by casting method, alloy, and process controls. Evidence role: mechanism; source type: research. Supports: That solidification during aluminum casting commonly produces internal porosity. Scope note: Advanced casting techniques such as low-pressure die casting and squeeze casting can substantially reduce porosity; the claim that air pockets ‘almost always’ form may overstate the defect rate for high-quality controlled casting processes. ↩
-
"Fatigue notch sensitivity of some aluminum alloys", https://nvlpubs.nist.gov/nistpubs/jres/52/jresv52n5p235_A1b.pdf. Fatigue mechanics research demonstrates that geometric stress concentrations, characterized by the stress concentration factor Kt, can reduce the fatigue life of metal components by orders of magnitude relative to smooth specimens, with severe notches capable of inducing failure within hundreds of cycles under high-amplitude loading. Evidence role: mechanism; source type: research. Supports: That stress concentrations dramatically reduce fatigue life in metal components, potentially causing failure within a small number of cycles. Scope note: The specific cycle count at failure depends on the magnitude of the stress concentration, applied load amplitude, and material properties; ‘a few hundred cycles’ is illustrative and not a universally applicable threshold. ↩
-
"[PDF] Review of the Effects of Micro structure on Fatigue in Aluminum Alloys", https://ntrs.nasa.gov/api/citations/19840014667/downloads/19840014667.pdf. Research in aluminum alloy processing demonstrates that forging induces preferred grain orientation along the direction of applied force, which enhances fatigue strength and resistance to crack propagation compared to the random grain orientation typical of cast components. Evidence role: mechanism; source type: research. Supports: That directional grain alignment produced by forging improves the mechanical strength and fatigue resistance of aluminum components. Scope note: The benefit of grain alignment is most pronounced in the direction of forging force; components with complex geometries may exhibit anisotropic properties that require design-specific analysis. ↩
-
"Steel Automotive Wheel Rims—Data Fusion for the Precise …", https://pmc.ncbi.nlm.nih.gov/articles/PMC10817687/. Engineering standards for wheel fatigue testing, such as those outlined in SAE J328, establish cycle thresholds intended to simulate extended service life, though the precise kilometer equivalence varies by test parameters and vehicle class. Evidence role: mechanism; source type: research. Supports: The relationship between radial fatigue test cycle counts and equivalent real-world driving distance. Scope note: Direct cycle-to-kilometer conversion figures are test-configuration-dependent and may not be universally standardized across all certification bodies. ↩
-
"Numerical simulation on 90° impact test of aluminium alloy …", https://pmc.ncbi.nlm.nih.gov/articles/PMC11549285/. SAE J175 and equivalent standards define impact test parameters for wheels, specifying drop mass and height to replicate the energy of a vehicle striking a road obstacle at a defined speed, commonly cited in the range of 50–65 km/h depending on vehicle class. Evidence role: mechanism; source type: institution. Supports: The impact test methodology and the real-world pothole strike speed it is designed to simulate. Scope note: The precise speed equivalence depends on test configuration variables including drop mass and wheel size; 60 km/h is a commonly cited approximation rather than a single universal standard value. ↩
-
"MEASURING DYNAMIC VEHICLE LOADS", https://onlinepubs.trb.org/Onlinepubs/sr/sr73/73-008.pdf. Vehicle dynamics research and road load data acquisition studies document that wheels experience continuously varying loads due to road surface irregularities, cornering, braking, and acceleration, with peak dynamic loads frequently exceeding static load values; this variability underpins the industry consensus that dynamic fatigue testing is more representative of service conditions than static proof load testing. Evidence role: expert_consensus; source type: research. Supports: That real-world wheel loading is predominantly dynamic rather than static, justifying dynamic fatigue testing as the more relevant certification method. Scope note: The relative importance of static versus dynamic testing may vary by application; heavy-duty or low-speed applications may present loading profiles closer to quasi-static conditions than typical passenger vehicle use. ↩
-
"An Approach for Predicting the Low-Cycle-Fatigue Crack Initiation …", https://pmc.ncbi.nlm.nih.gov/articles/PMC9104331/. Fracture mechanics and fatigue theory, including Miner’s rule of cumulative damage, establish that each stress cycle contributes incrementally to material fatigue, and that internal discontinuities such as voids or inclusions serve as preferential crack initiation sites under cyclic loading conditions. Evidence role: mechanism; source type: research. Supports: That cyclic loading causes cumulative fatigue damage in metals, with internal defects acting as crack initiation sites that grow progressively under repeated stress. Scope note: Miner’s rule is a linear approximation; actual fatigue damage accumulation is nonlinear and influenced by load sequence effects, mean stress, and material microstructure. ↩
-
"Applicability of Federal Motor Vehicle Safety Standards Test …", https://www.regulations.gov/document/NHTSA-2020-0119-0001. U.S. DOT wheel certification requirements are administered under relevant Federal Motor Vehicle Safety Standards, while TÜV certification references European standards such as those derived from ECE regulations; both frameworks incorporate dynamic performance criteria as conditions of approval. Evidence role: general_support; source type: government. Supports: That U.S. DOT and TÜV certification frameworks include dynamic fatigue testing requirements for wheels. Scope note: DOT does not directly certify individual wheels in all cases but sets standards manufacturers must self-certify against; the precise dynamic test mandate may vary by wheel category and market. ↩
-
"Review of Magnesium Wheel Types and Methods of Their … – PMC", https://pmc.ncbi.nlm.nih.gov/articles/PMC10856444/. Published comparisons of forged and cast aluminum wheel specifications indicate that forged wheels of equivalent dimensions typically achieve higher load ratings, with differences commonly reported in the range of 10–20%, attributable to reduced porosity and improved grain structure. Evidence role: statistic; source type: research. Supports: Comparative load rating ranges between forged and cast aluminum wheels of equivalent dimensions. Scope note: Specific load rating figures vary significantly by manufacturer, alloy grade, and wheel geometry; the ranges cited should be treated as illustrative rather than universal industry benchmarks without independent test data attribution. ↩