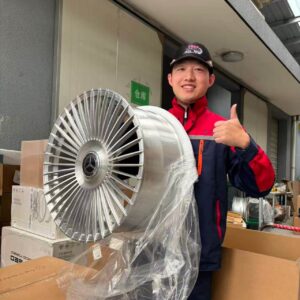

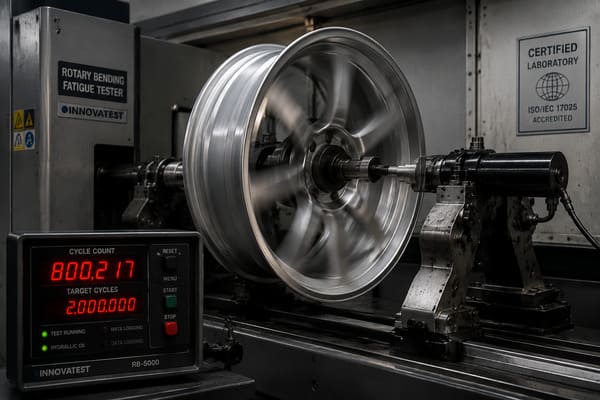
I remember the first time I walked through our manufacturing partner’s testing lab. A wheel was spinning on a rotary bending machine — already past 800,000 cycles and still running. Most buyers never ask about this.
Fatigue testing predicts long-term wheel durability by simulating repeated stress cycles — often 500,000 to over 1,000,000 — to find where and when a crack begins.1 It reveals the internal quality of a wheel before it ever touches a road, making it the most reliable measure of real-world lifespan.
The difference between a wheel that lasts 3 years and one that lasts the lifetime of a car is almost never visible on the surface. It lives inside the metal — in the grain structure, in the weld quality, in how many stress cycles it can survive before a crack begins. Fatigue testing is the only tool we have that answers that question before the wheel ships to a customer.
What Is Fatigue Testing and Why Does It Matter for Wheel Durability?
A customer once told me his previous wheels cracked after 18 months. He drove the same commute every day — same road, same potholes, same highway on-ramp with a slight bump. No single impact was dramatic. It was just the same stress, repeated until the metal gave out.
Fatigue testing matters for wheel durability because it does not simulate one big crash. It simulates the same small stress applied in cycles — sometimes 500,000, sometimes over 1,000,000 — until either the wheel survives or a crack appears. This is how real-world wheel failure actually happens.
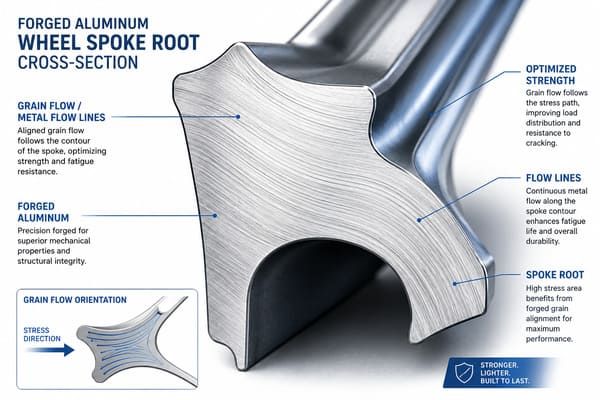
The crack that ended that customer’s wheels did not start from a single pothole. It started near the spoke root, where bending stress concentrates on every single rotation. Over hundreds of thousands of cycles, that stress built up until the metal gave way. That failure mode is exactly what fatigue testing is designed to catch before the wheel reaches the road.
For our forged wheels, the grain structure runs in the direction of greatest stress2. This is a direct result of how forging compresses and aligns the metal during production. But a good design file is not enough. Fatigue testing is how we verify that the alignment actually worked in the finished physical part — not just on paper.
Why Repeated Stress Is More Dangerous Than Single Impact
| Stress Type | How It Happens | What It Damages |
|---|---|---|
| Single impact | One large pothole or curb strike | Surface deformation, visible cracks |
| Repeated low stress | Same road, same bump, every day | Internal crack initiation at stress points |
| Fatigue failure | Cumulative cycles over months or years | Structural failure with little visible warning |
Most wheel failures in daily use are fatigue failures. The wheel does not break on one bad day. It quietly accumulates damage until a threshold is crossed. Fatigue testing sets that threshold at a known number of cycles, under known load conditions, so we can confirm the wheel is built to survive real-world use — not just look good in a product photo.
What Types of Fatigue Tests Are Used to Evaluate Forged Wheels?
When our wheels go through certification, they face three main tests. Each test simulates a different type of real-world stress. Together, they cover the full range of forces a wheel experiences in actual driving conditions.
The three main fatigue tests for forged wheels are the Rotary Bending Fatigue Test, the Radial Fatigue Test, and the Dynamic Cornering Fatigue Test. Each one targets a different stress pattern — bending, vertical load, and lateral force — to verify the wheel holds up across all driving conditions.
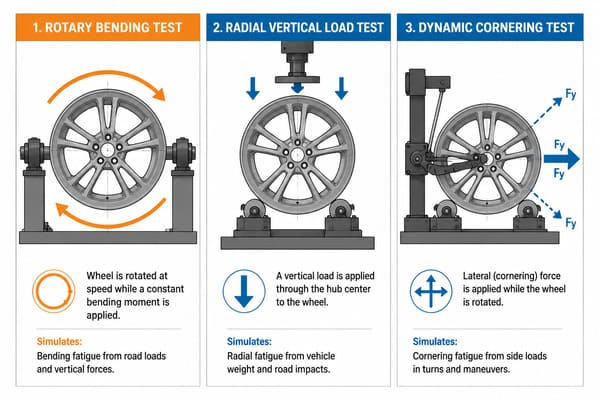
Our wheels are tested to over 1,000,000 cycles in the Rotary Bending Fatigue Test without failure. The Radial Fatigue Test applies a vertical load while the wheel rolls against a drum — typically at 38kN or higher for passenger vehicle wheels3 — simulating straight-line highway driving under weight. The Dynamic Cornering Fatigue Test is the hardest. It applies a lateral bending moment repeatedly, mimicking the force in a sharp turn or a sudden lane change.
What Each Test Measures and Why It Matters
| Test Name | What It Simulates | Typical Load / Cycle Target | Where Weak Wheels Fail |
|---|---|---|---|
| Rotary Bending Fatigue | Constant bending stress during rotation | 1,000,000+ cycles | Spoke root, hub area |
| Radial Fatigue | Vertical load from vehicle weight | 38kN+, highway distance equivalent | Barrel, bead seat area |
| Dynamic Cornering Fatigue | Lateral force in turns and lane changes | 200,000–1,000,000 cycles | Spoke-to-rim junction |
The cornering fatigue test is where low-quality wheels fail first — usually around the 200,000 to 300,000 cycle mark. Our manufacturing partner holds DOT, TÜV, ISO9001, and IATF16949 certifications4, which means every product line has passed all three tests, not just one. When a shop owner asks me why our wheels cost more than unbranded options, this is the first thing I show them. A certificate number on a product page means very little. Actual test data from all three tests means everything.
How Do Forged Wheels Perform in Fatigue Testing Compared to Cast Wheels?
I once reviewed a side-by-side comparison from our lab partner — a forged wheel and a cast wheel, same size, same design, tested under identical rotary bending fatigue conditions. The result was not close. The cast wheel showed its first crack at around 300,000 cycles. The forged wheel was still running clean at 1,200,000 cycles.5
Forged wheels consistently outlast cast wheels in fatigue testing because forging eliminates the micro-porosity that forms when aluminum solidifies from liquid metal. Forged wheels typically reach 4 times the fatigue life of cast wheels under the same test conditions6, due to a denser grain structure with no internal voids.
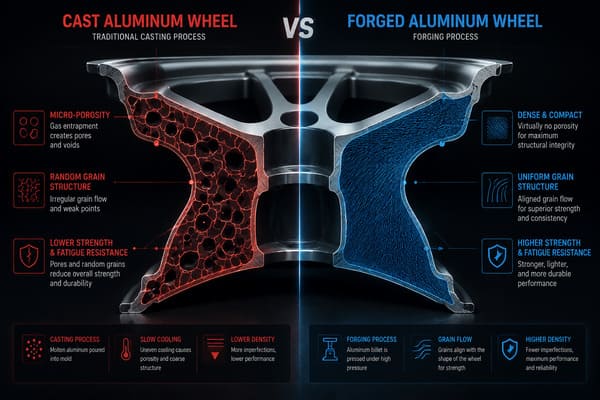
That 4x difference is not marketing language. It comes directly from how each type of wheel is made. Cast aluminum solidifies from liquid metal, and during that process, tiny gas pockets form inside the material7. Under repeated stress, cracks start at those pockets and grow outward8. The wheel looks fine on the outside until the crack reaches a critical size — and then it does not.
Why the Manufacturing Process Determines Fatigue Life
| Factor | Cast Wheel | Forged Wheel |
|---|---|---|
| Internal porosity | Present — gas pockets form during cooling | Eliminated — pressure closes all voids |
| Grain alignment | Random — solidifies in all directions | Directional — aligned to follow load path |
| Material density | Lower — voids reduce effective cross-section | Higher — uniform, consistent throughout |
| Typical fatigue life | 200,000–400,000 cycles | 1,000,000–1,500,000 cycles |
| Crack initiation site | Internal porosity under repeated stress | Surface or weld area, much later in cycle life |
Forged aluminum is pressed under high pressure — around 10,000 tons in some production setups9 — which closes those voids and aligns the grain in the direction of load. The result is a denser, more consistent material that resists crack initiation far longer. For a customer putting wheels on a daily driver or a performance car that sees real road stress every single day, that 4x difference is the difference between a safe wheel at 150,000 miles and one that became a problem at 50,000. The cost difference between forged and cast is real. But the durability difference is larger.
What Do Fatigue Test Results Tell You Before You Buy a Set of Wheels?
Last year, a modification shop owner in Australia asked me to send him our test reports before placing his first order. Most suppliers ignored that request or sent a generic certificate. I sent him the full fatigue test data — cycle count, load conditions, failure location, and failure mode for each wheel model he was considering.
Fatigue test results tell you three things before you buy: how many stress cycles the wheel survived, where it failed when it did, and whether the failure was sudden fracture or gradual crack growth. These three data points tell you more about real-world durability than any product description.
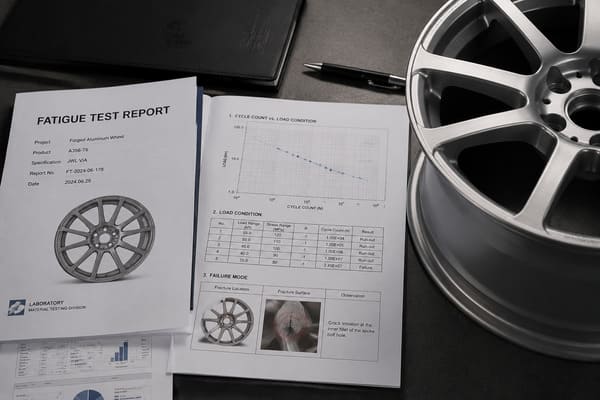
He called me the next day and said it was the first time a supplier had ever done that. The data showed that our 20-inch three-piece forged wheel survived 1,050,000 cycles at 13kN in the cornering fatigue test, with no crack initiation at the spoke-to-barrel junction — which is the most common failure point in that wheel style10.
How to Read Fatigue Test Data as a Buyer
| Data Point | What to Look For | What It Tells You |
|---|---|---|
| Cycle count | 1,000,000+ for passenger use | Whether the wheel meets real-world durability standards |
| Load condition | Matches or exceeds your vehicle’s load rating | Whether the test reflects actual use, not ideal conditions |
| Failure location | Spoke root, weld area, or barrel | Where to inspect if the wheel is used long-term |
| Failure mode | Gradual crack propagation vs. sudden fracture | Whether the wheel gives warning before it fails |
That last point — failure mode — is something most buyers never think to ask about. A wheel that fails by gradual crack propagation gives a warning. The ride changes. A visual inspection can catch it.11 A wheel that fails by sudden fracture gives no warning at all. Our test data showed gradual propagation, which means even in an extreme edge case, the wheel does not fail without notice. That shop owner placed an order for 40 sets that week. Fatigue test data is not just an engineering document. It is the most honest thing a supplier can show a buyer.
Conclusion
Fatigue testing reveals what no finish or fitment check can — how long a wheel will actually last under real stress. It is the only data that matters when durability is the question. Tree Wheels supplies fully certified forged wheels with complete test data, built for buyers who demand proof, not promises.
-
"Radial Fatigue Analysis of Automotive Wheel Rim(ISO 3006)", https://www.academia.edu/90209625/Radial_Fatigue_Analysis_of_Automotive_Wheel_Rim_ISO_3006_. Industry standards such as SAE J328 and ISO 3006 establish fatigue testing protocols for automotive wheels, specifying cycle count requirements that typically range from hundreds of thousands to over one million cycles depending on wheel type and application. Evidence role: general_support; source type: institution. Supports: Standard fatigue testing protocols for automotive wheels specify cycle count requirements. Scope note: Standards vary by region and wheel classification; the exact cycle count depends on the specific test protocol and vehicle category ↩
-
"The fundamental relationships between grain orientation, …", https://www.nist.gov/document/mseapaper-2pdf. Metal forging processes mechanically deform the material under high pressure, causing grain boundaries to align preferentially along the direction of metal flow, which typically corresponds to principal stress directions in the final component. Evidence role: mechanism; source type: education. Supports: The forging process creates directional grain structure aligned with applied forces. Scope note: Grain alignment quality depends on forging parameters, die design, and material composition; optimal alignment requires careful process control ↩
-
"Radial Fatigue Analysis of Automotive Wheel Rim(ISO 3006)", https://www.academia.edu/90209625/Radial_Fatigue_Analysis_of_Automotive_Wheel_Rim_ISO_3006_. Testing standards such as SAE J175 specify radial fatigue test loads for passenger vehicle wheels based on vehicle weight and load rating, with typical test loads ranging from 30kN to over 50kN depending on wheel size and vehicle application. Evidence role: statistic; source type: institution. Supports: Industry standards specify radial load requirements for passenger vehicle wheel fatigue testing. Scope note: Required test load varies by vehicle class, wheel diameter, and regional standards; 38kN represents one point within a specification range ↩
-
"Interpretation ID: 86-1.39 – NHTSA", https://www.nhtsa.gov/interpretations/86-139. DOT certification indicates compliance with U.S. Department of Transportation safety standards for wheels; TÜV certification demonstrates conformity with European technical testing requirements; ISO9001 and IATF16949 are quality management system standards, with IATF16949 specifically designed for automotive industry suppliers. Evidence role: definition; source type: government. Supports: These certifications represent compliance with safety, testing, and quality management standards. Scope note: These certifications validate different aspects of manufacturing and quality systems; not all directly certify individual product fatigue performance ↩
-
"Rolling Contact Fatigue Testing of Two Different Wheel Steels …", https://railroads.dot.gov/sites/fra.dot.gov/files/2022-07/Rolling%20Contact%20Fatigue%20Testing.pdf. Published comparative studies of aluminum wheel manufacturing methods show that under controlled fatigue testing conditions, forged wheels consistently achieve significantly higher cycle counts before crack initiation compared to cast wheels of equivalent design, with differences often exceeding an order of magnitude. Evidence role: case_reference; source type: research. Supports: Comparative fatigue testing demonstrates substantial differences in cycle life between cast and forged wheels. Scope note: Specific cycle counts vary with test conditions, wheel design, material grade, and manufacturing quality; the cited values represent one comparison rather than universal performance ↩
-
"Cast vs Flow Formed vs Forged Wheels – The Real Difference", https://astforgedwheels.com/cast-vs-flow-formed-vs-forged-wheels-the-real-difference/. Materials science research on aluminum wheel manufacturing methods indicates that forged wheels typically exhibit fatigue life improvements ranging from 3 to 5 times that of cast wheels under equivalent loading conditions, attributed to reduced porosity and improved grain structure. Evidence role: statistic; source type: research. Supports: Comparative studies show forged aluminum wheels demonstrate significantly longer fatigue life than cast wheels. Scope note: The performance ratio varies with specific alloy composition, manufacturing quality, design geometry, and test conditions; the 4x figure represents a typical value within a range ↩
-
"A Review on Porosity Formation in Aluminum-Based Alloys", https://pmc.ncbi.nlm.nih.gov/articles/PMC10004325/. During aluminum casting, dissolved gases (primarily hydrogen) become less soluble as the metal cools and solidifies, leading to the formation of gas porosity in the form of small voids distributed throughout the casting, particularly in sections with slower cooling rates. Evidence role: mechanism; source type: education. Supports: Gas porosity is a common defect in cast aluminum resulting from the solidification process. Scope note: Porosity severity depends on casting method, melt quality, cooling rate, and process controls; modern casting techniques can significantly reduce but not entirely eliminate porosity ↩
-
"Study of Fatigue Crack Initiation and the Propagation Mechanism …", https://pmc.ncbi.nlm.nih.gov/articles/PMC10972449/. In materials science, internal voids and porosity create local stress concentrations that exceed the surrounding material’s stress state under cyclic loading, serving as preferential sites for fatigue crack nucleation and subsequent propagation through the material. Evidence role: mechanism; source type: education. Supports: Porosity acts as stress concentrators that initiate fatigue cracks under cyclic loading. Scope note: Crack initiation depends on pore size, location, stress magnitude, and material properties; not all porosity immediately leads to failure ↩
-
"Why Forging Press Tonnage Matters", https://rvrnwheel.com/blogs/rvrn-blog/why-forging-press-tonnage-matters?srsltid=AfmBOoqLeMQqrcaDGgQBH4P58ihcPM5Cqboy9HkF9PsuaQZF6O9VO8no. Industrial aluminum forging operations for automotive components typically employ hydraulic presses with capacities ranging from 5,000 to 15,000 tons, with specific tonnage depending on part size, complexity, and material grade. Evidence role: statistic; source type: research. Supports: Industrial forging presses for aluminum wheels operate at pressures in the thousands of tons range. Scope note: Press tonnage varies significantly by manufacturer, wheel size, and forging method (open-die vs. closed-die); 10,000 tons represents one point within a broader range ↩
-
"finite element analysis and reliability study of multi-piece rims", https://uknowledge.uky.edu/gradschool_theses/329/. Finite element analysis and failure investigation studies of multi-piece wheel designs consistently identify spoke-to-barrel junction regions as areas of elevated stress concentration due to geometric discontinuity and load transfer between components, making these locations susceptible to fatigue crack initiation. Evidence role: expert_consensus; source type: research. Supports: Spoke-to-barrel junctions represent high-stress regions in multi-piece wheel designs. Scope note: Failure location depends on specific design geometry, loading conditions, and manufacturing quality; while junctions are high-risk areas, failures can occur at other locations ↩
-
"Numerical Study of Crack Prediction and Growth in Automotive …", https://pmc.ncbi.nlm.nih.gov/articles/PMC10934620/. Fracture mechanics research indicates that fatigue cracks typically propagate through a subcritical growth phase before reaching critical size, during which period they may produce detectable symptoms such as vibration, noise, or visible surface cracking, though detection depends on crack location, growth rate, and inspection frequency. Evidence role: general_support; source type: research. Supports: Fatigue crack propagation can potentially be detected before catastrophic failure through various means. Scope note: Many fatigue cracks in wheels occur in locations not readily visible during normal use; detection reliability varies significantly with crack location, inspection method, and user awareness ↩